CEGridSight: check the record, then go deeper
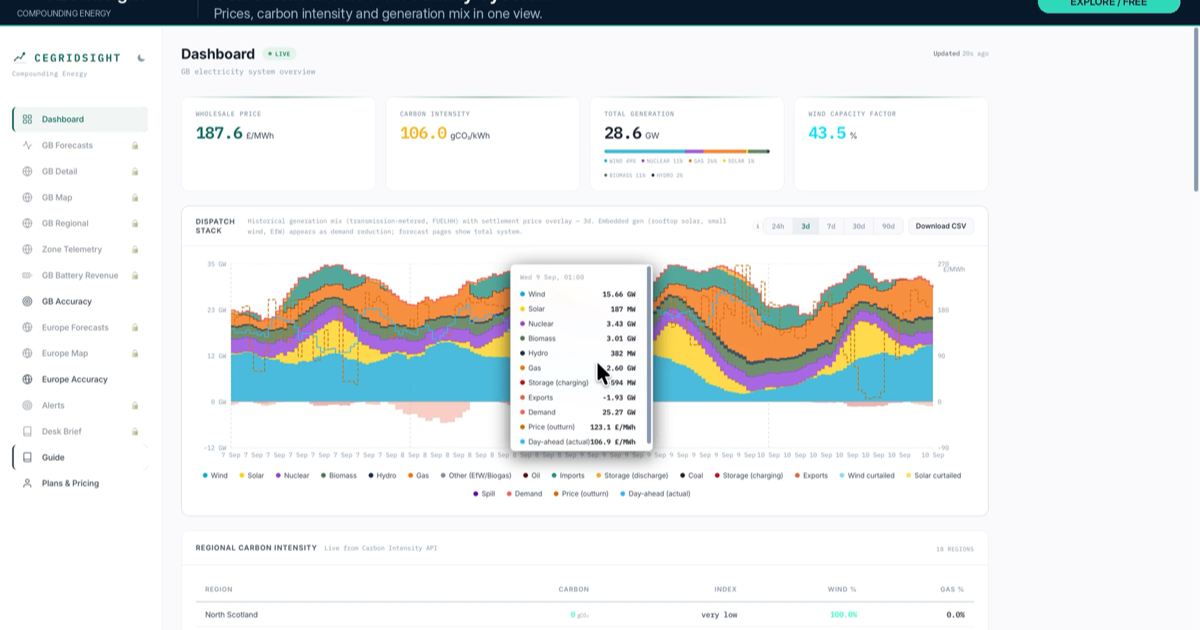
A walkthrough of CEGridSight in the order we would suggest for a first visit: the free live grid, history and public accuracy record, then the 14-day forecast workflow for GB and Europe.
Read →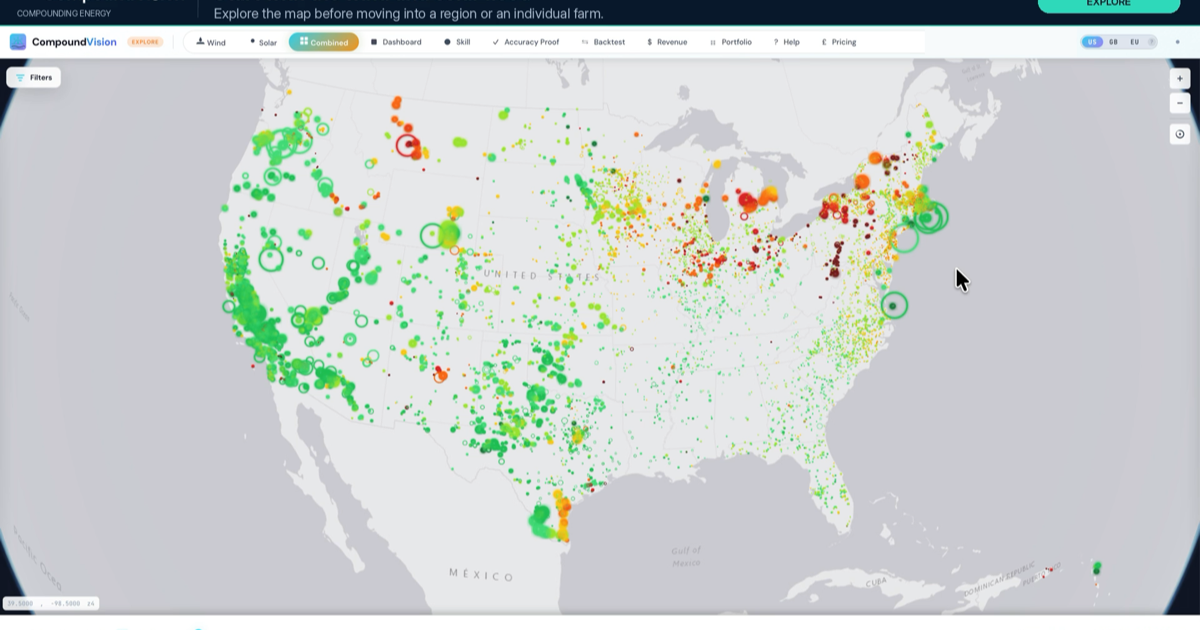
CompoundVision in motion: from the whole fleet to the individual farm
A silent walk through CompoundVision: from the globe of 29,000+ wind and solar farms to a single asset, the public skill scorecard, P10–P90 bands, backtest replay and revenue.
Read →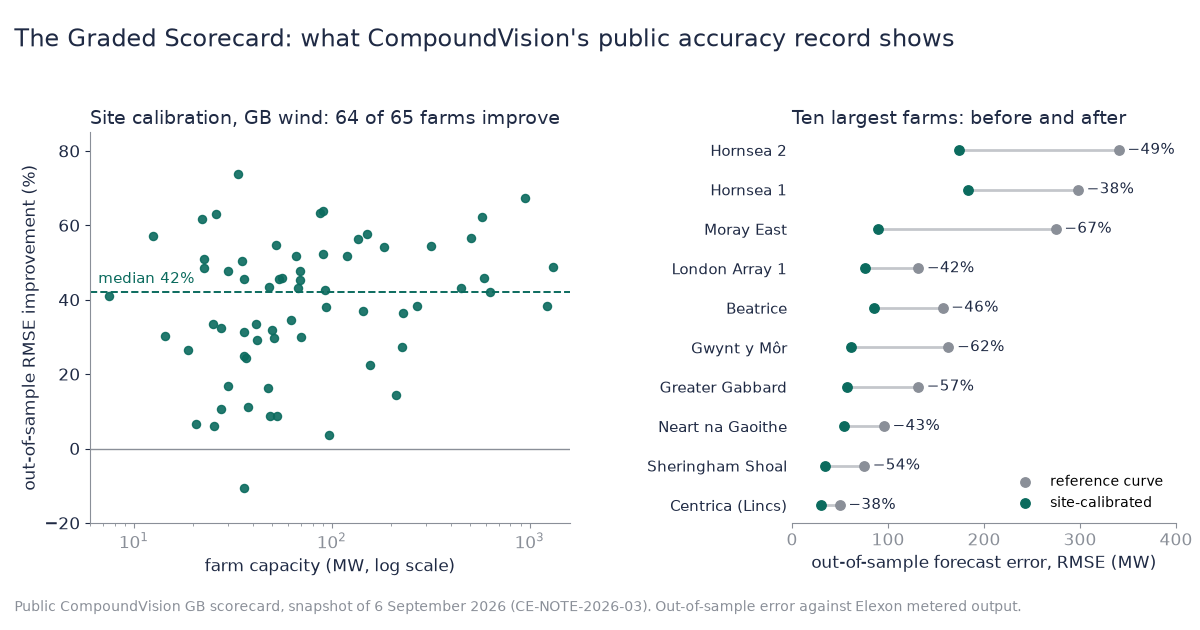
Forecast accuracy you can check: what site calibration does to GB wind farm error
On the 6 September scorecard, fitting each wind farm's power curve to its own metered output cut forecast error for 64 of 65 GB farms, by a median 42%. Find your farm's numbers in the searchable table.
Read →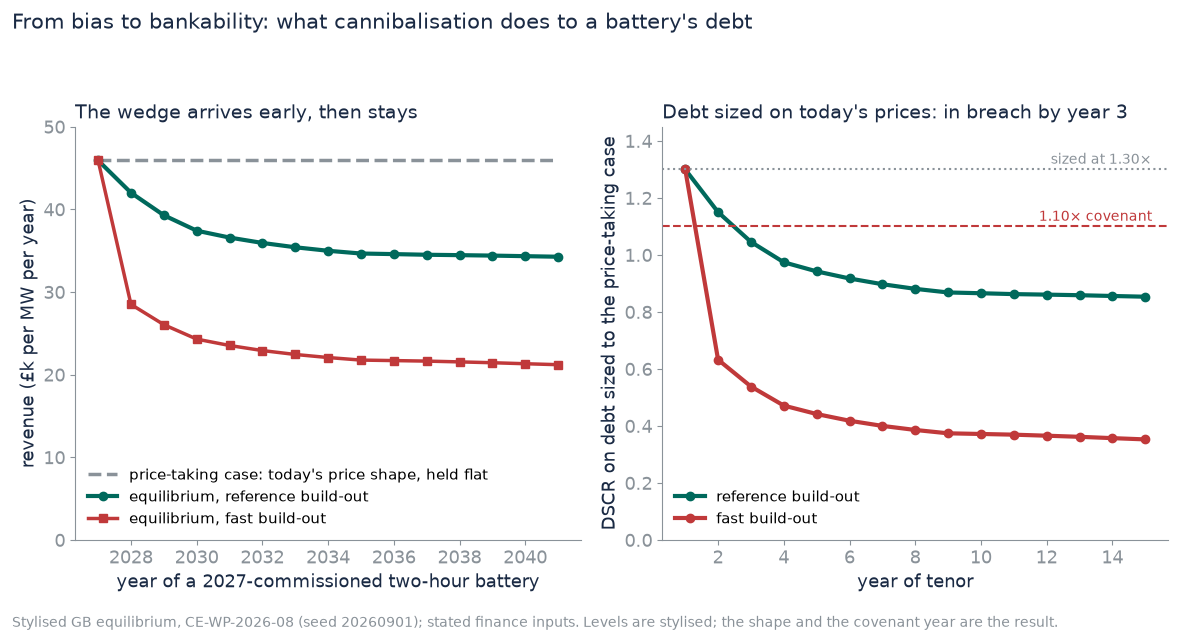
What cannibalisation does to a battery's debt: the covenant year, not a haircut
A 2027 two-hour battery followed through a fifteen-year tenor at equilibrium: the revenue wedge against today's price shape arrives in the first three years and stays; debt sized on today's prices breaches a 1.10× covenant in year three; debt sized at equilibrium is 25% smaller — 60% on a fast build-out.
Read →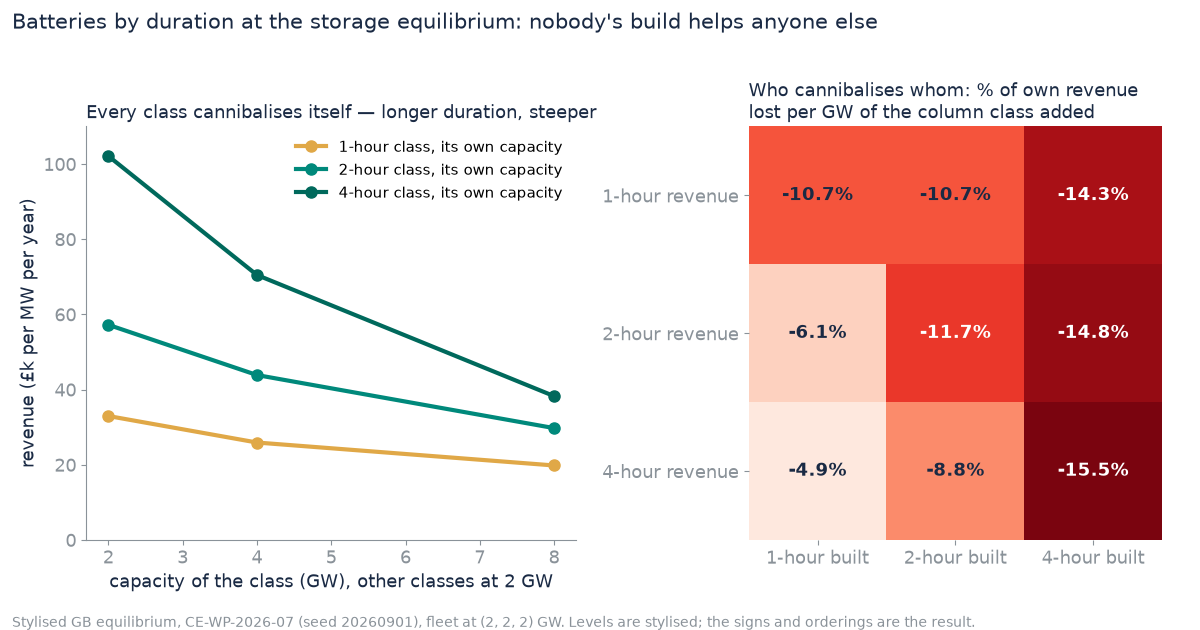
Which battery duration to build, given what everyone else has built
One-, two- and four-hour batteries solved jointly at equilibrium across 63 fleet mixes: every cross-effect is negative, own-effects are steepest for four-hour, and the asymmetry has two faces — long duration loses the most pounds to a build, short duration the larger share.
Read →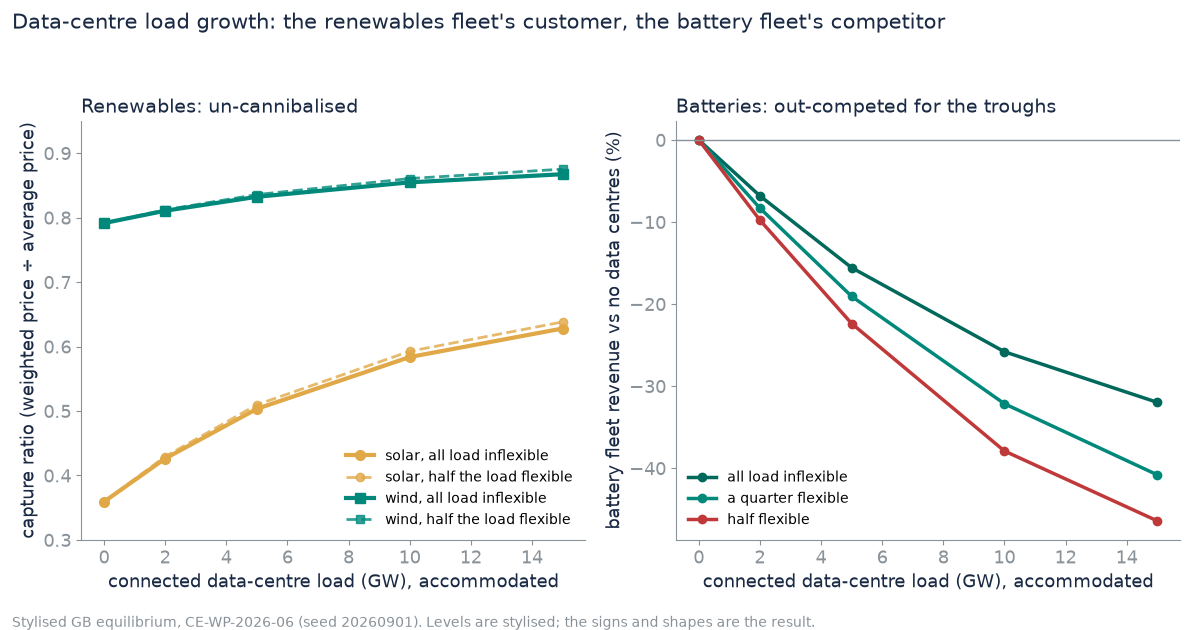
Data centres: the renewables fleet's best customer, the battery fleet's newest competitor
Gigawatts of data-centre load priced at equilibrium: load planned for un-cannibalises wind and solar (solar capture 0.36 → 0.58 at 10 GW, +£1.7bn a year) and fills the troughs batteries charge in (−26% fleet revenue, −38% with half the load flexible) — opposite signs at every penetration we ran.
Read →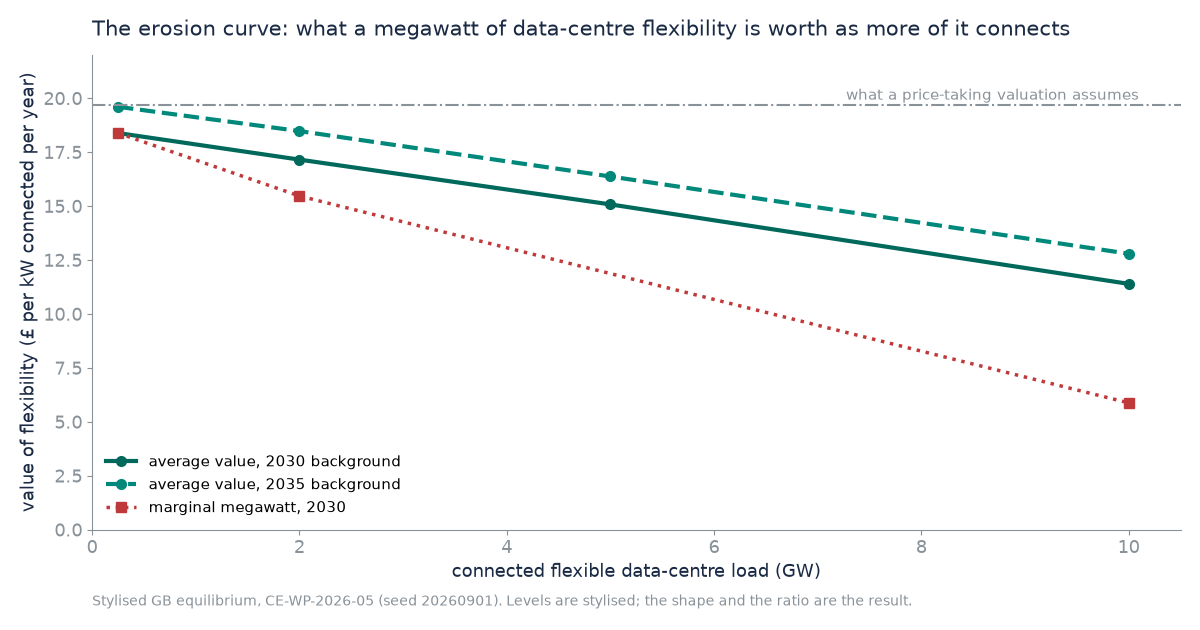
What is a megawatt of data-centre flexibility worth when ten gigawatts of it exist?
Data-centre flexibility priced at the equilibrium its own scale creates, not at today's prices: the marginal flexible MW loses 62% of its value between 2 and 10 GW, price-taking valuations overstate by 1.15–1.73×, and 10 GW of flexible load takes 21% off GB battery fleet revenue.
Read →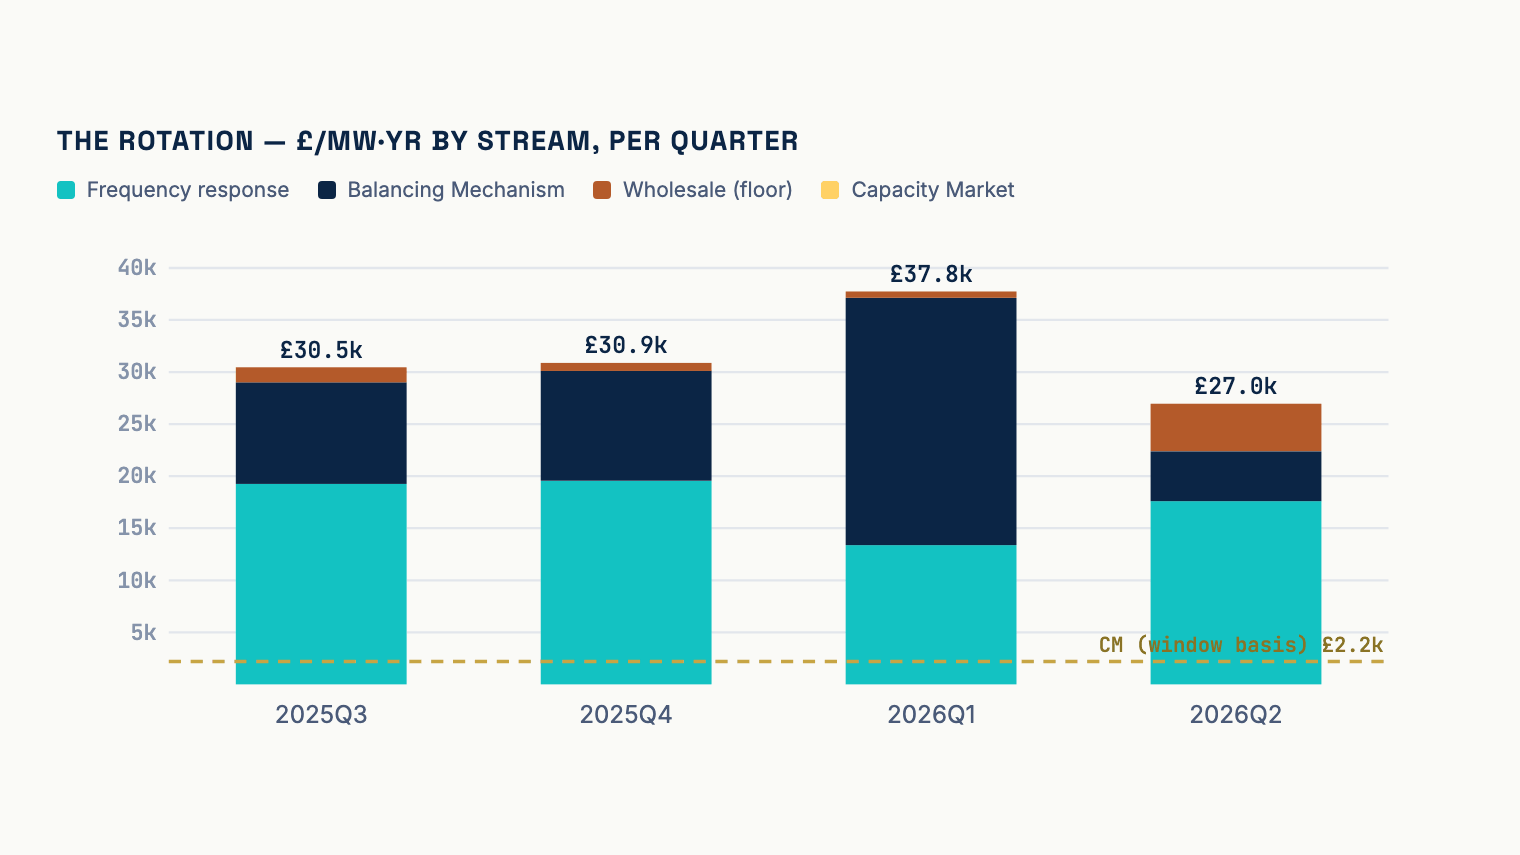
One year of measured GB battery revenue: what 6.4 GW actually earned
At least £33.7k/MW·yr, measured from settlement — not modelled. The fleet grew 15%, frequency response saturated, the Balancing Mechanism absorbed the megawatts, and the top quartile out-earned the median by as much as the median itself.
Read →
Now live in CEAtlas: free global wind and solar capacity factors
Pick any coordinate on Earth: mean wind or solar capacity factor, every year 1940–2025 on the map, P50/P90 and trend — free, no card. A free account (email only) adds the 12 × 24 profile, the annual bars and all 8,760 hourly values for 2025. CEAtlas Analyst and Desk download the same site's full 86-year hourly record.
Read →
Why I'm Building Compounding Energy: Getting the right answers in time to act
A revenue forecast that treats a battery as a price-taker overstates returns by 100–300% at the fleet Great Britain plans for 2030. Why I founded Compounding Energy — and the standard every product ships to.
Read →