Every forecast provider quotes an accuracy number. Very few let you check it. CompoundVision publishes its scores openly, farm by farm and region by region. This note pins them to stated dates so they can be cited, and here they are in plain terms.
Public CompoundVision scorecard, 6 September 2026.
What site calibration means
A wind farm forecast turns predicted wind into power using a power curve. A standard curve is the same for every farm. Site calibration fits the curve to the farm's own metered output instead. To measure what that is worth, the scorecard forecasts the same days with both curves, on days the fitted curve never saw, and compares each with what the farm actually generated.
What it found
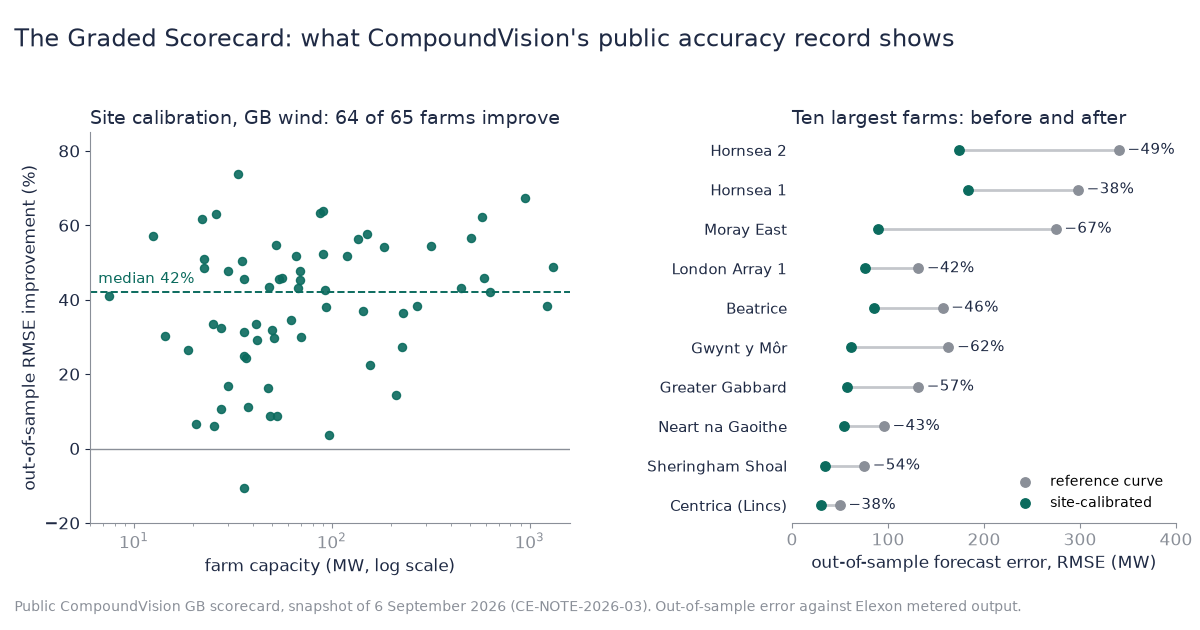
- Nearly every farm gains, and by a lot. On 6 September, 64 of 65 scored farms improved, with a median cut in forecast error of 42%. Two weeks later the result held: 59 of 61, median 46%.
- The biggest farms gain most. Weighted by size, the ten largest cut their error by 50%, against 37% for the rest.
- It is a range, not a promise. On 6 September half the farms improved by between 29% and 52%, and a handful moved little or scored worse. They are in the table below too.
Find your farm
Type a farm's name to see its forecast error with the standard curve and with its own fitted curve, and how much the error was cut on each date.
| Wind farm | Capacity (MW) | Error before → after, 6 Sep (MW) | Cut, 6 Sep | Cut, 20 Sep |
|---|
Forecast error is the typical size of the miss in MW on days held back from fitting. The cut is the reduction from the standard curve to the fitted one; a negative cut means the fitted curve did worse. "Not scored" means the scorecard withheld the farm on that date. Public CompoundVision scorecards of 6 and 20 September 2026.
Against the simplest benchmark
A second scorecard checks each region's whole-fleet forecast, up to 48 hours ahead, against persistence: the simplest benchmark, which assumes output stays where it is. Across 38 regions in Europe and the United States, solar beat it in 29 of 30 on both dates, and wind in most. Where a region's wind score sits near zero it can flip from one week to the next, so judge a region on several weeks, not one.
What to ask any forecast provider
Ask for the whole distribution, the exceptions and the date. A single accuracy number cannot be checked. A dated table like the one above can.