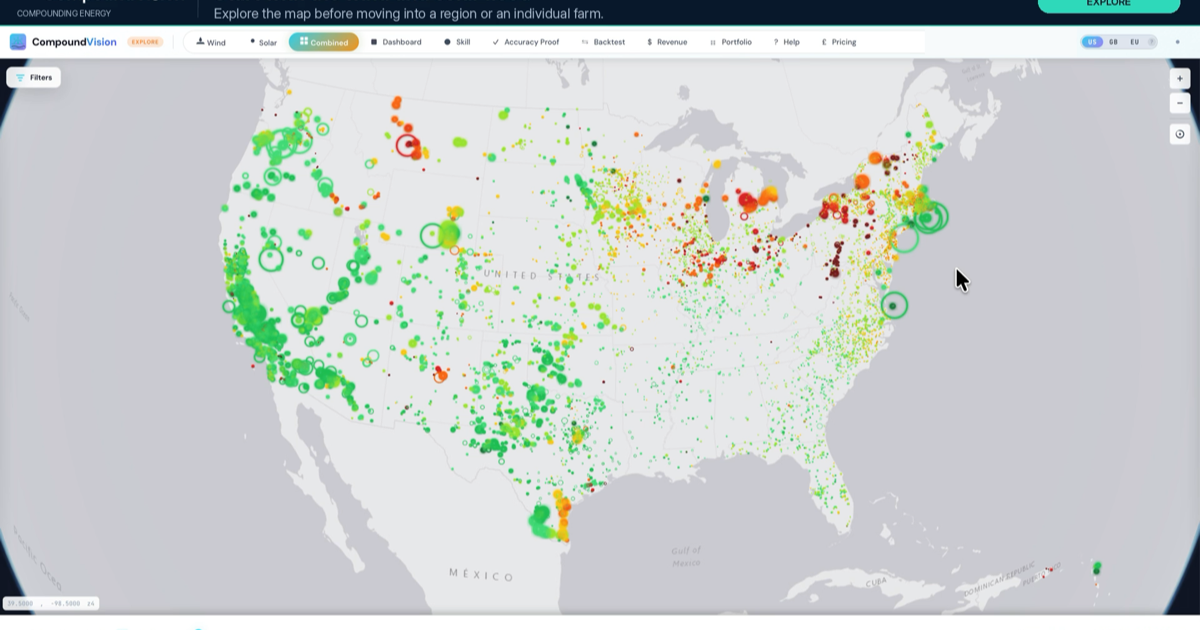
A fleet-level forecast answers the first question — how much wind and solar is coming — but the decisions that follow are made one site at a time: a farm whose output you sell, or whose ramps decide tomorrow's position. The useful workflow moves from the whole fleet to the individual farm, and then to the evidence behind that farm's forecast. The demonstration below follows that path through CompoundVision across wind and solar assets in Great Britain, Europe and the United States, from the interactive globe to a single asset's report.
The complete workflow in four minutes: move around the globe, switch between wind and solar, filter and search, check the public scorecard, then open a farm's bands, ramps, weather drivers, resource profile, backtest and revenue.
Start with the fleet
CompoundVision opens on an interactive globe of the fleet: 29,000+ wind and solar farms across the US, GB and Europe, about 1,030 GW of nameplate, of which 26,000+ farms and around 769 GW are operating today. Each farm is forecast one at a time, hourly, 16 days ahead, from the weather at its own site and the equipment actually installed.
The demonstration begins by moving around the globe, switching between wind and solar, and narrowing the view. Filters cut the fleet by region, ISO or state; capacity and generation counters sit alongside the counts of wind and solar farms; and a search box takes you straight to a named asset. That is the moment the forecast stops being a national number and becomes a specific site.
Check the record before subscribing
Before any subscription, the public skill scorecard is open to inspect — no login, no card. It scores forecast skill per region and fuel against system-operator actuals, updated daily, and breaks it out by forecast lead time for days 1 to 16. Where skill is negative, that is published rather than hidden, because a scorecard that only shows the good days is not evidence.
The demonstration pauses here on purpose. Differences by region and by lead time sit together, so the decision to go deeper is made with the record in front of you. Check the record first, then decide whether to subscribe.
Go deeper at the farm
With a subscription, every farm is clickable and the asset-level tools open. The demonstration shows a single farm's forecast compared across weather models — the fleet is run on up to 5 + 2 weather models plus ensembles, with high-resolution models leading the early days and global models carrying days 11 to 16 — so disagreement between models is visible rather than averaged away. A single line is a forecast with the doubt removed. Probabilistic P10–P90 bands come from real weather ensembles of 31 and 51 members, are labelled with how they were made, and are widened where a farm's specifications are inferred rather than known. Upcoming ramps are identified. The horizon is composed honestly: 384 hours deterministic in every region, with validated blends carrying the front and clearly labelled tail members the back; probabilistic bands run to 360 hours everywhere.
The forecast then sits alongside its weather drivers, and beside the site's longer-run resource profile in the Resource Atlas: the resource capacity factor from our physics run over the native ERA5 record back to 1940, the CEAtlas reference case beside it, and a delivered-energy comparison where the site is metered — US and GB wind today, with everything else served on a resource basis and labelled so. It is available per farm across the operating fleet of 10 MW and up, with monthly matrices, P10–P90 bands and downloads.
The evidence behind the forecast
The last stop is the full asset report. The backtest viewer compares forecasts with observed generation, replaying any past forecast over what actually happened, so performance is read from the record rather than assumed. Per-farm scorecards against GB settlement meters are recomputed weekly, with 70 farms published and 66 scored today, and an EU per-unit scorecard covers 3 wind farms today, growing as metered depth accrues, curtailment-filtered. One number from that record explains why the product forecasts each farm from its own equipment: site-fitting each farm's power curve cuts capacity-weighted RMSE by 58% against a generic reference curve.
Revenue follows the same chain: forecast power multiplied by the day-ahead price, per farm and per region. And because the forecast is built from 30+ documented physical steps — atmospheric stability, the turbine's own power curve, wake losses, panel temperature, soiling, inverter clipping — a miss can be traced to the step that caused it. Every step has a citation and a test. That is what makes the move from fleet to farm worthwhile: the farm-level forecast is a result you can take apart.
What each tier opens
Explore is free and needs no card: the full fleet map and the public scorecards. Analyst makes every farm clickable, with a 2-day horizon, bands and portfolios. Desk extends the horizon to 5 days and adds revenue, skill, ramp alerts and exports across three named seats. Enterprise carries the full 16-day horizon, your own assets with data-quality badges, the full REST API and the replay archive. Analyst and Desk each come with a 14-day trial.
Why the questions belong together
Where is the generation, when is it coming, how uncertain is it, and how has the forecast performed? A ramp is only useful with its uncertainty attached, and a band is only credible with a record behind it. CompoundVision keeps the four together, per farm, from the same physics, against the same scorecards: a ramp in the forecast can be checked against the weather driver that causes it and the band around it, and the forecast's skill at that lead time is on the public scorecard beside it. This is the actual product in motion, from the map to the farm to the evidence behind the forecast.
Start with the free Explore plan: the full fleet map and the public scorecards need no card. Plans and horizons are on the pricing page, and the product page carries the detail. Then open the app and find your own farm.