Before you subscribe to a forecasting tool, you should be able to inspect its track record. CEGridSight, our electricity-market forecasting and analysis platform for Great Britain and Europe, is built so that you can: the live grid, the history and the full accuracy record are free to explore with no card required, and the paid workflow is reached from that evidence rather than instead of it. The demonstration below follows that order, from the free pages to the 14-day forecast workflow.
The complete walkthrough in four minutes twenty seconds: the free Dashboard and history window, the GB and Europe accuracy pages, then the 14-day forecasts, generator maps and dispatch slideshow, battery revenue, European views and cross-border flows, the desk brief and alerts.
Start with what is free
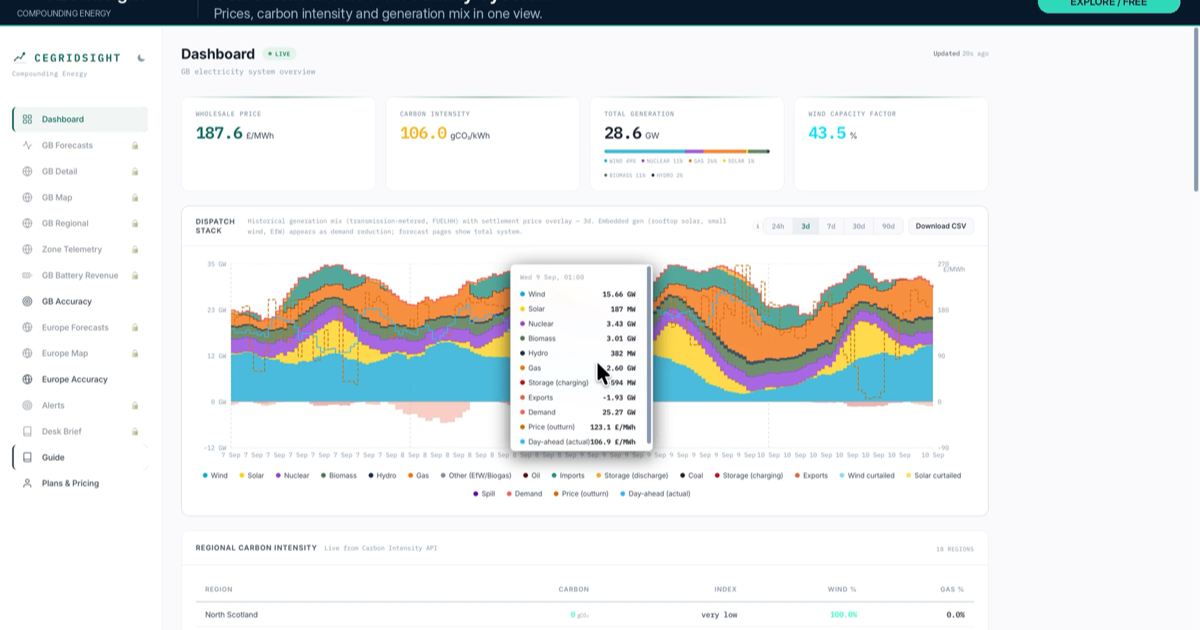
The demonstration begins where a first visit does, on the Dashboard. It shows the live GB grid — generation mix, demand and price — and it is free, with no card required. The generation mix is the dispatch stack, live. The history look-back can be set to 24 hours, three days, seven days, 30 days or 90 days, so the view that shows this afternoon also shows the last three months.
Two things are worth doing here. Change the time window and watch how the stack shifts between wind, solar and the plant that fills in behind them. Then compare today so far against the forecast that was published for it. The free Explore tier does not include a forward forecast; what it includes is everything you need to judge one.
Look beyond one accuracy number
The accuracy pages are also free, and they are where the platform makes its case. Every forecast vintage is persisted before the settlement period it covers and then graded against the settled market. GB day-ahead forecasts are scored per settlement period against Elexon's settled traded index — a harder benchmark than the day-ahead auction — and the real-time track against the imbalance price. The track record page needs no login and nothing on it is hand-picked.
A single headline number would hide most of what matters. The GB Accuracy and Europe Accuracy pages let you look at the errors themselves, at the market conditions around them, and at how performance differs between European bidding zones. Where a forecast is weak matters as much as its average, and you should be able to find both before you pay.
Fourteen days, half hour by half hour
The walkthrough then moves into the subscription workflow. On the Analyst plan (£1,495 a month) the GB Forecasts page carries a 48-hour horizon with full GB detail on price, generation and carbon, and CSV export. On Desk (£4,995 a month, three named seats) the horizon extends to 14 days at half-hourly resolution, refreshed by four full solves a day. Analyst and Desk both carry a 14-day trial.
The forward charts carry their own skill bands, and they should be read with them. Days 0–3 are the Operating band: the high-skill near-term forecast for dispatch and day-ahead trading. Days 3–10 are the Trading band, for forward markets, week-ahead positions and fuel planning. Days 10–14 are Scenario and Planning: wide uncertainty, for risk planning and weather-event watch, not for committed positions. A 14-day horizon is useful precisely because the platform says which parts of it to trust for what.
An electricity price is the last link in a physical chain. Weather drives demand and renewables, a full model of the grid dispatches every power station, and the price falls out at the end, across 43 zones. For GB the solve runs in two stages: a national wholesale market whose dual sets the served price, then a 17-zone redispatch that produces constraint costs and zonal prices. The production wholesale problem is solved by our own CEMeridian engine with an enforced optimality certificate, with an open-source fallback on standby. The thin per-hour calibration on top is bounded, audited and suppressed whenever it fails its own walk-forward gate. Because the model is physical, you can ask it why — which plants set the price, what congestion cost, what the wind did to the evening peak — and the answers are inside the solve, not added afterwards.
From the map to the asset
On Desk, the GB Map puts the generator fleet on a map and adds a dispatch slideshow: press play and the dispatch runs as a sequence rather than a single snapshot. GB Regional resolves the country into its 17 transmission zones — constraint costs and zonal prices rather than a national average — and Zone Telemetry shows, for each bidding zone, the dispatch by fuel, the zonal price and the cross-border flows.
Battery Revenue analytics sit alongside. Per-asset BESS capture is computed downstream of the price solve, so it can never distort the forecast, and it is available in both national and zonal bases.
Europe, flows, the brief and alerts
Desk also opens the European views. The Europe Forecasts and Europe Map pages cover 26 European bidding zones coupled with GB in the same solve — a 43-zone pan-European unit commitment covering more than 10,000 individual power stations — and the Europe page includes a cross-border flows chart.
Three further pieces complete the desk layer: a 30-minute real-time nowcast, anchored to the day-ahead curve and graded against the imbalance price by lead-time bucket; a programmatic API with keys; and the Desk Brief and Alerts.
Enterprise, from £250,000 a year, extends Desk to five or more seats organisation-wide, with a negotiated SLA, redistribution and internal data-feed rights, API at scale, custom regions and zones, and on-prem options. Full detail is on the pricing page.
Check the record, then go deeper
That is the loop: a physical forecast, a public grade, and enough detail to see which link of the chain moved. The aim is to connect the market outlook to the physical system behind it, and to make the evidence inspectable. The walkthrough's order is the one we would suggest for a first visit. Explore the live system. Check the scorecard. Go deeper when the workflow earns it.
Launch CEGridSight, see the public track record, or read the product overview.