We have just published the CECadence Quarterly GB BESS Index for 2025Q3–2026Q2 — a full trailing year of GB battery fleet revenue, measured from settlement.
Not modelled. Not surveyed. Not licensed from a benchmark provider. Computed from Elexon settlement cashflows and NESO auction records for the full 168-BMU battery registry, with every convention and every exclusion quantified, so a lender's analyst can verify it line by line.
The headline: the active fleet — 6.4 GW across 153 metered units — earned at least £33.7k/MW·yr over the trailing year.
The rotation is happening in the settlement data
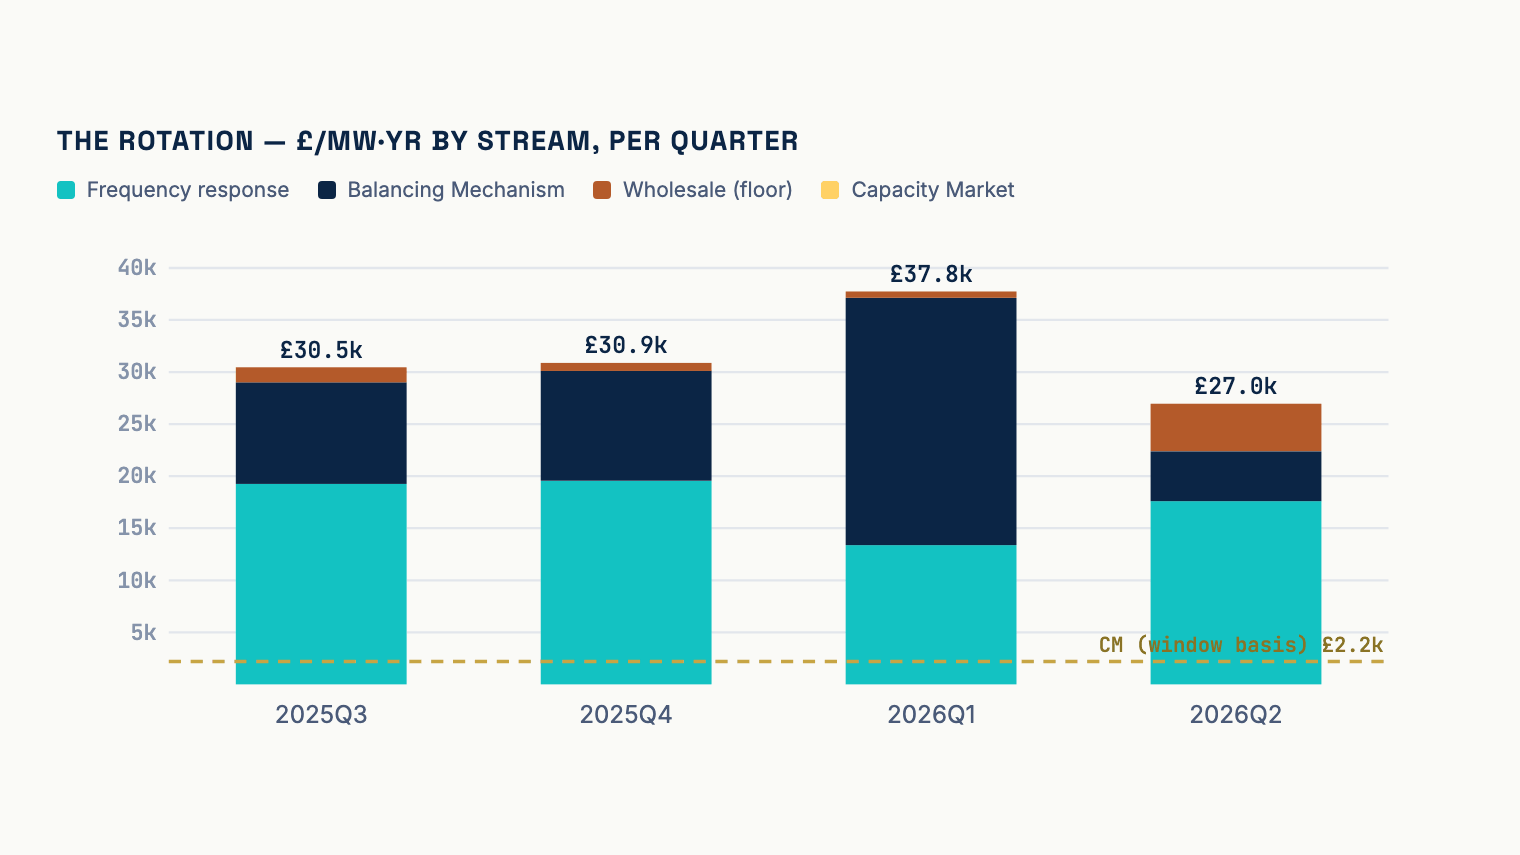
Frequency response is still the largest stream: £17.4k/MW·yr, 55% of the trailing-year total. But it is shrinking exactly the way fleet economics says it must. The active fleet grew 15% inside the window — 5.53 GW to 6.37 GW — FR prices saturated under the new supply, and the Balancing Mechanism absorbed the megawatts: £12.2k/MW·yr, 39% of the year.
The FR decline is price-driven, not volume-driven — and "FR" is not one market. Inside the label, Dynamic Regulation Low cleared 30% higher across the year (£13.25 → £17.22/MW/h) while Dynamic Regulation High cleared at −£8.71/MW/h in 2026Q2. Treating frequency response as one line misprices entry.
Per-MW revenue is volatile — and the latest quarter was the softest
£30.5k → £30.9k → £37.8k → £27.0k across the four quarters, annualised per active MW. A tight 2026Q1 lifted everything; Q2 gave most of it back even as wholesale conditions improved — a mean market index price of £95/MWh, 144 negative-price settlement periods, and the best 2h spread-capture ratio of the window at 29%.
The operational premium is now as big as the median
Across the 113 units active in all four quarters, the median earned £35.1k/MW·yr. The top quartile averaged £70.2k. That £35.2k gap — strategy, siting, execution — is as large as the median itself. Seven units measured negative under the index conventions.
And location does more work than duration. Across transmission-charging zones, the best-to-worst spread in Balancing Mechanism revenue alone is £85.7k/MW·yr — while the 1h and 2h classes finished the year within about £1k of each other (≥£34.2k vs ≥£33.1k). The 4h class measured just ≥£10.2k, but those units are net BM payers whose value lands in paid cheap charging — a convention effect the report quantifies rather than hides.
What we refuse to smooth over
The wholesale line is a metered-at-MID floor: it charges the fleet's round-trip losses and instructed throughput to the arbitrage leg, so totals are printed as "≥" rather than grossed up by a model. Our measured 2h cycling — 1.07 cycles/day in Q2, the highest of the window — sits below the public 1.2–1.5 band; we publish the measurement, not the band. Everything is initial settlement and will revise. Even the exclusions are quantified, down to the 15 registered-but-inactive units whose revenue we kept out of the numerators.
Why we build it this way
The forward question every battery investor actually has — what will my site earn as the fleet keeps doubling? — can only be answered credibly from a measured baseline. This index is that baseline. CECadence's equilibrium forecasts project it forward under fleet build-out scenarios, to the fixed point where the fleet's own behaviour is already priced in. A revenue model that cannot reproduce the measured past has no business projecting the future.
The full index is free, four pages, with every convention and exclusion disclosed.
Contains BMRS data © Elexon Limited copyright and database right 2026 · Supported by National Energy SO Open Data. Initial settlement; figures revise. Measured market data, not advice.