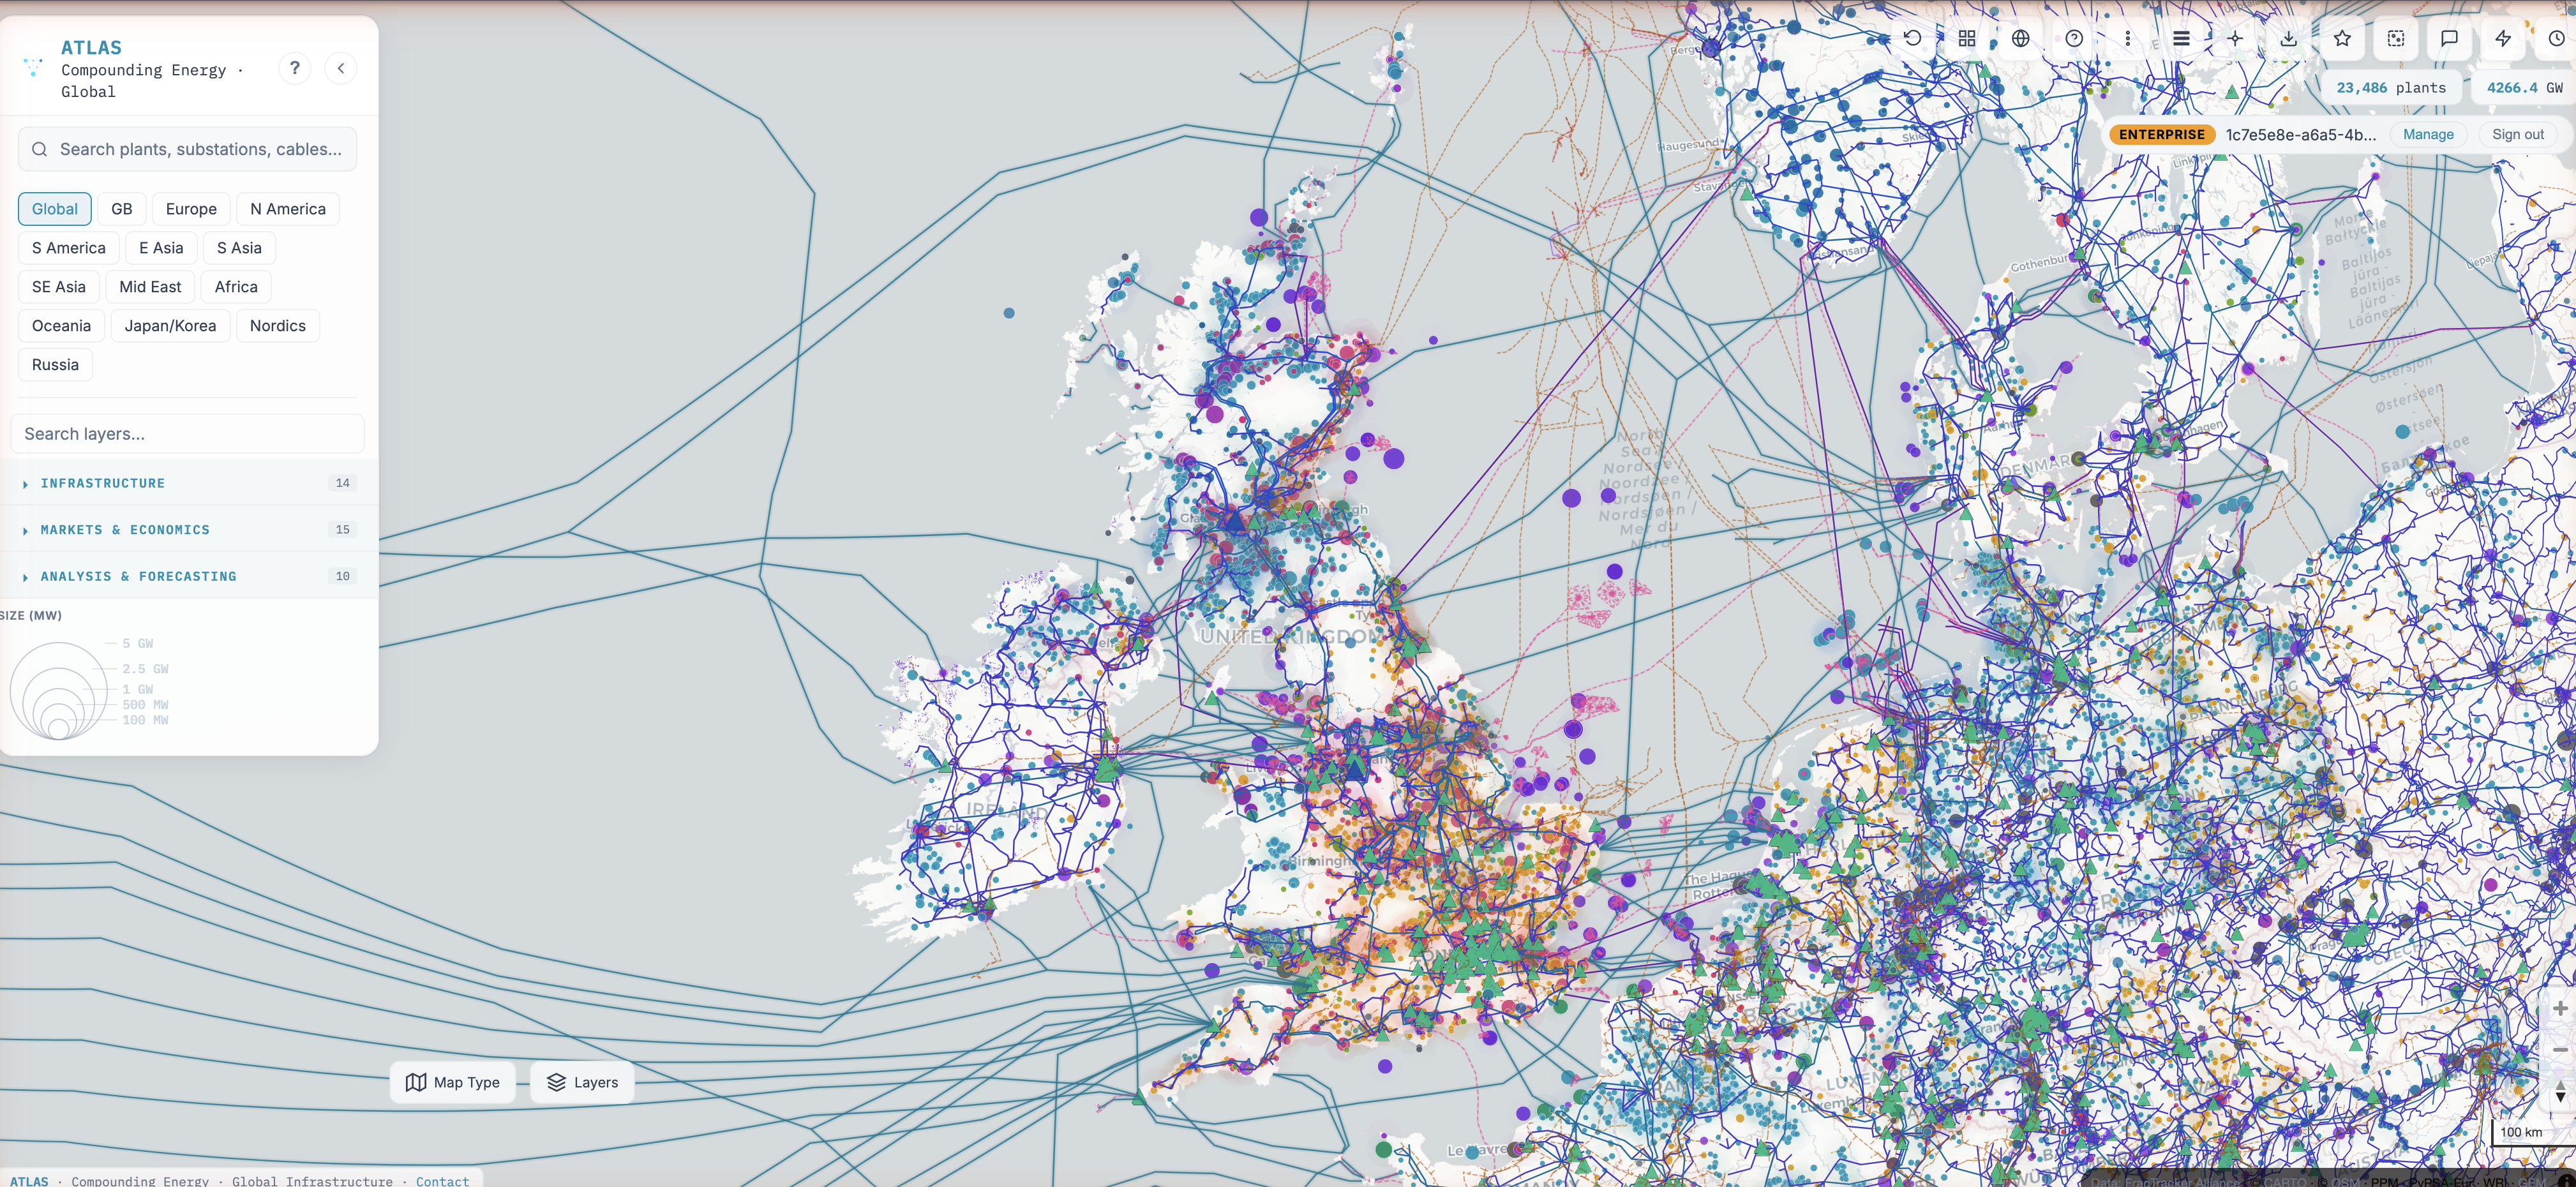
On Desk and up, CENovaSage’s nodal forecasts cover all nine US regions, hourly for today and tomorrow: about 20,000 buses on one map, with per-bus prices, line flows and unit dispatch. GB and Europe come from CEGridSight’s zonal model four times a day, 14 days out, across 17 GB transmission zones and 26 EU bidding zones.
The weather store holds 86 years of hourly wind speed and irradiance at any coordinate on Earth (1940–2025). From it the map serves mean capacity factors, 12×24 profiles, full hourly downloads, P50/P90 and trend. Every year, the P50/P90 and the trend are free on the map.
Checked against meters
We re-modelled 583 US onshore wind plants (87 GW, 2019–2024) at each plant and compared the result with EIA-923 metered generation. Across the 570 plants with true monthly meters, the median correlation of monthly shape is r = 0.877. That measures how closely the model follows each plant’s month-to-month pattern; it is not a percentage accuracy. Metered output comes in at a median 82% of the modelled level, and we publish that too. Solar against PVGIS gives an hourly r of 0.95 for fixed-tilt and 0.90 for trackers, and wind against MERRA-2 a median annual-speed r of 0.89 at 36 sites. The validation was run in July 2026 and is re-checked weekly on the free accuracy page.
Tools
The Data Assistant is a tool-using analyst over the full dataset. From chat it can screen connections, look up live prices and run a full 8,760-hour 24/7 study. Every figure it gives is source-cited, and it declines to answer rather than guess.
Pipeline mode takes a CSV of candidate sites, scores each one for Connection Difficulty Score, headroom, suitability and nearest substation, and returns a ranked export.
What is free
With no card: the global map, 29 of the 33 United States layers, the Fleet Census with the US build pipeline and plant changes, and wind and solar resource at any coordinate (86-year mean and median, every year since 1940 on the map, P50/P90, variability and trend). A free account, email only, adds full hourly 2025 at any coordinate on the map and as a download, the 12 × 24 profile, the annual bars and one site analysis.
The Fleet Census is free for everyone. It profiles the US, GB, EU and world power fleets by age, additions, retirements and build pipeline, with per-plant lifecycle records and measured output where meters exist. The US pipeline and the monthly plant changes refresh with each EIA-860M release.